What county election websites (unevenly) tell voters
A national audit of 2,804 county sites, and why the rural gap is mostly a size gap
This is a post in Rural Notes, my working-notes series on rural measurement and rural political behavior. It overviews a paper I presented at ESRA 2026, Uneven Access, joint work with Will McLean. The draft is below. It is preliminary: the findings are pending a blind inter-coder reliability re-code, so please don’t cite without asking.
Download the working paper (PDF)
The question
Counties run the bulk American elections at the local level, and for a lot of voters the county election website is the first place they actually meet that work: checking a registration, finding a polling place, requesting a mail ballot, looking up results. So a simple question: what do those sites tell voters, and how evenly?
The honest answer is that we didn’t know. The one well-known study, King and Youngblood’s 2016 audit of Alabama county sites, found that counties provide limited information and fall short on accessibility and usability. But it was one state, almost a decade old, and from before 2020 reorganized how Americans vote. Nobody had checked whether Alabama was typical.
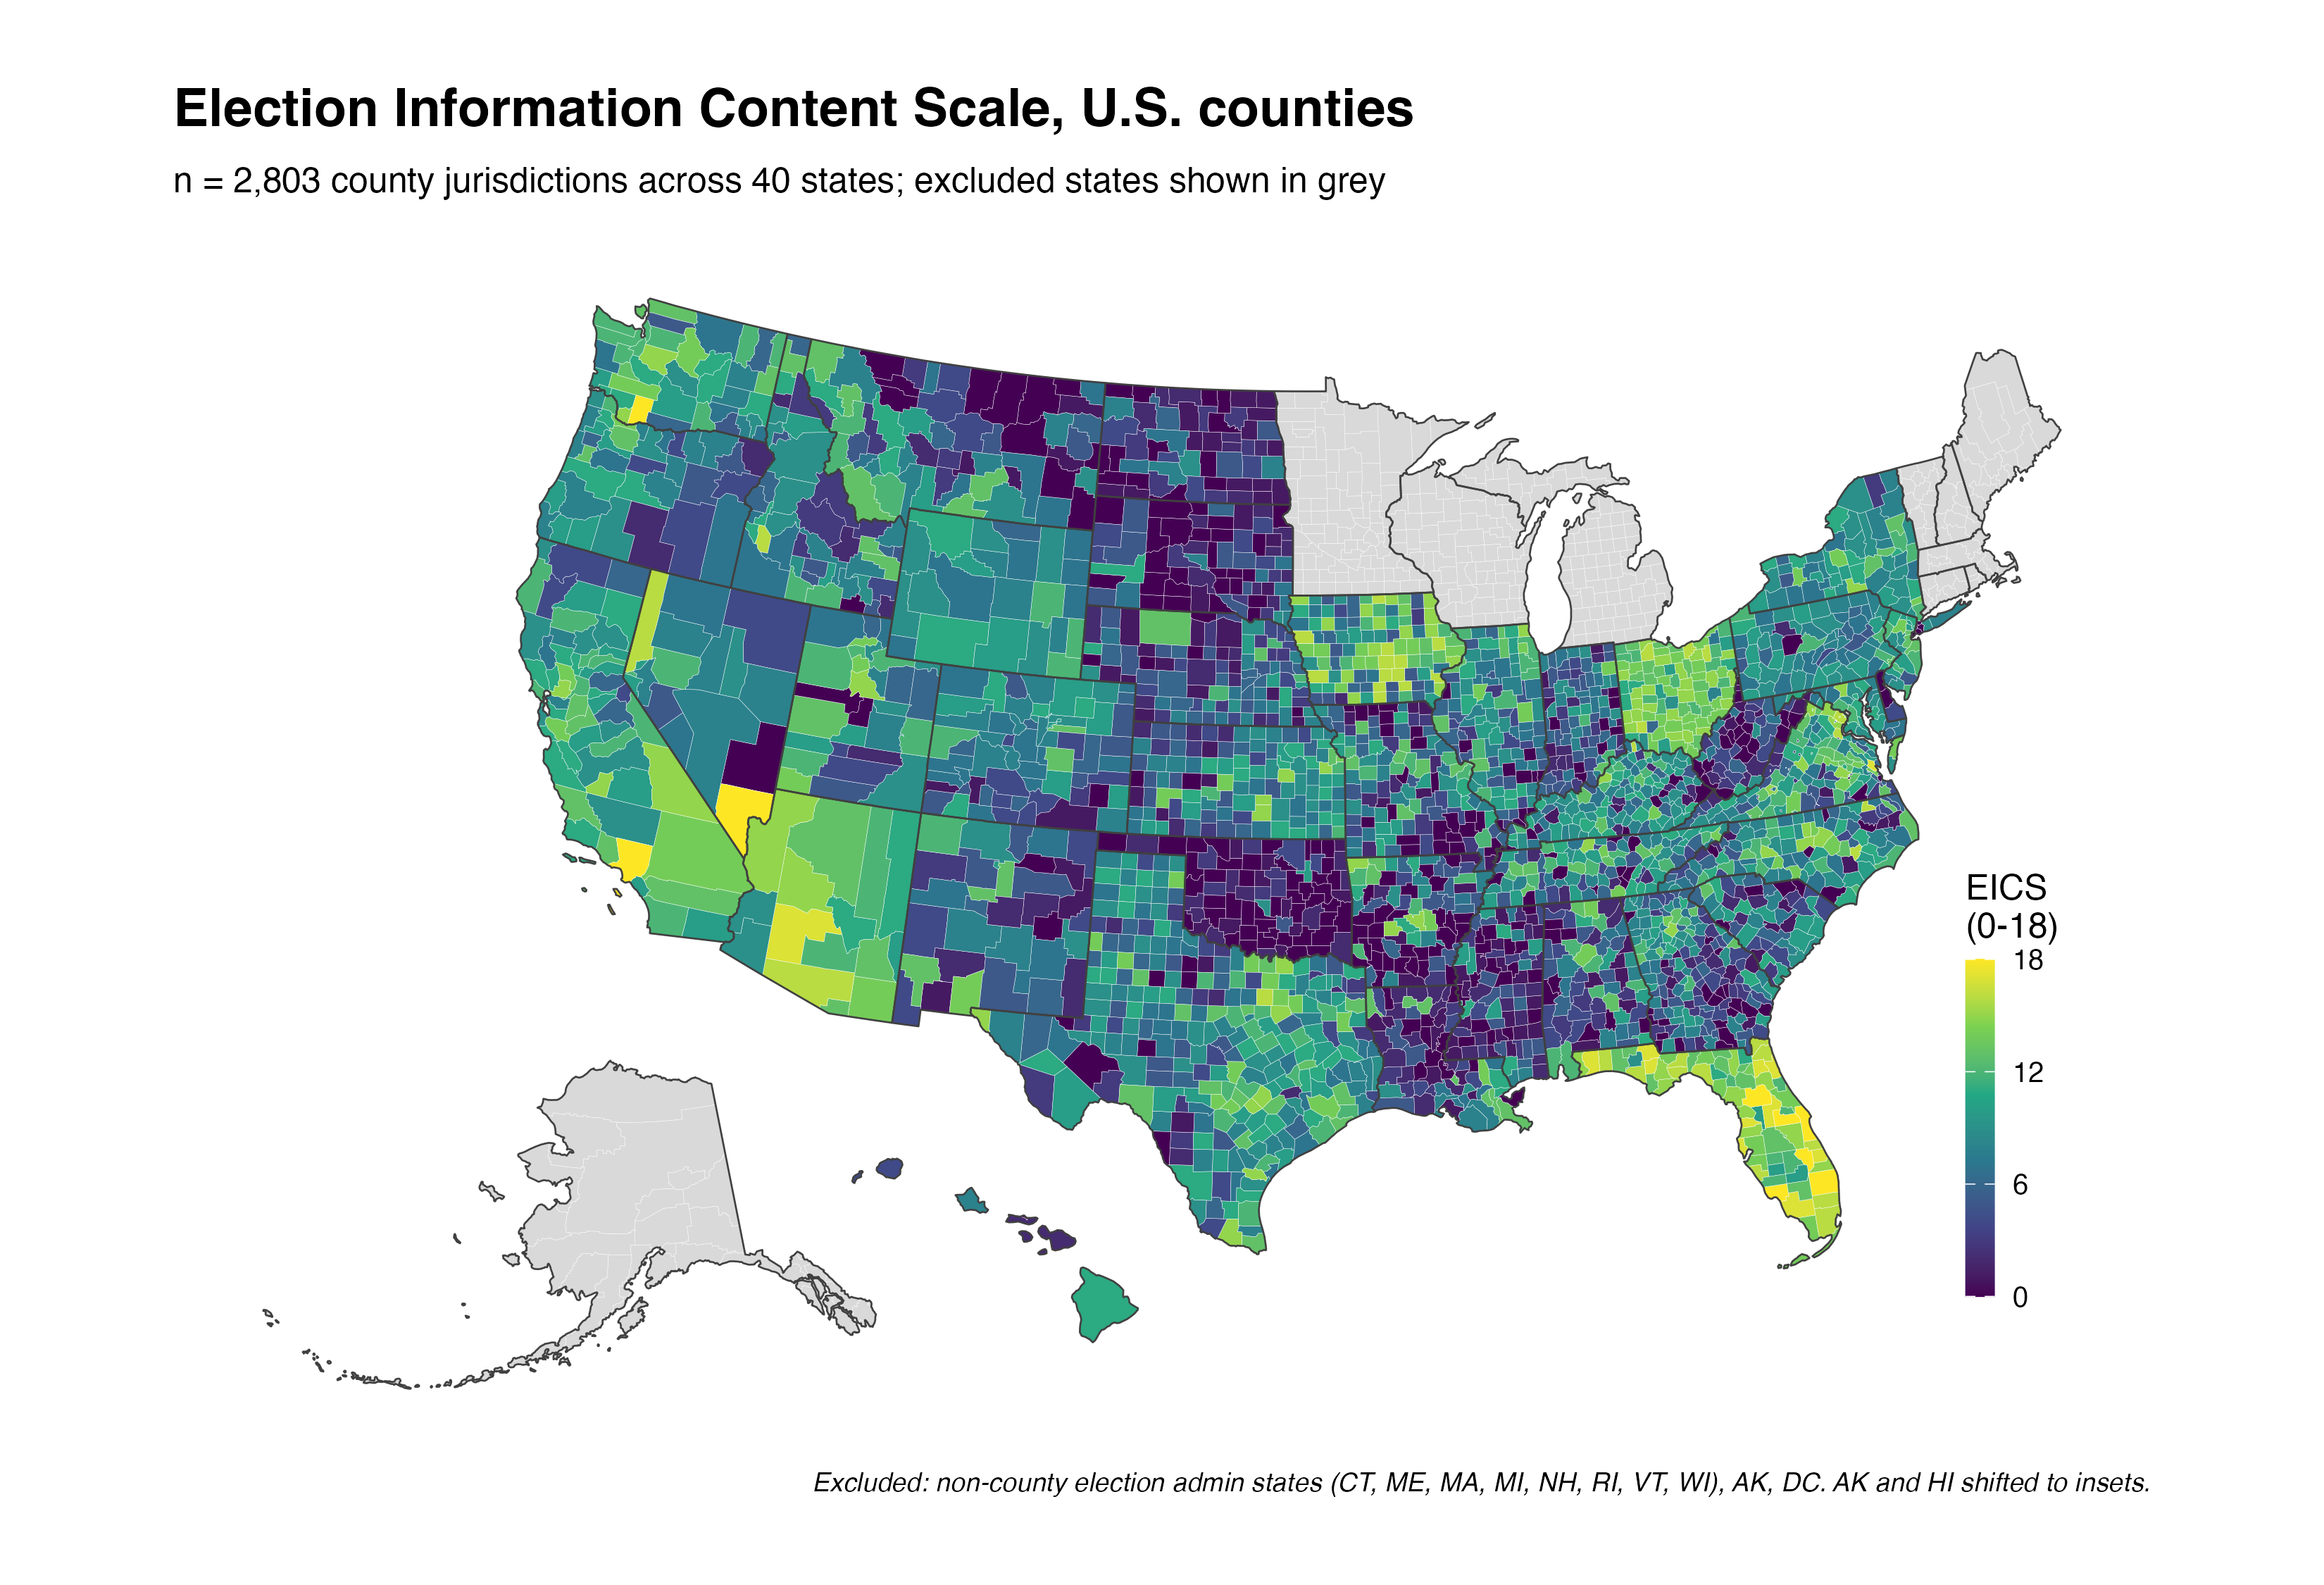
So Will McLean and I built a national audit. We scored the election websites of 2,804 county jurisdictions across 40 states on an 18-item Election Information Content Scale (EICS), extending the King and Youngblood framework with three items that got salient after 2020: mail-ballot tracking, signature cure, and felon-rights restoration. We dropped the states where the county isn’t the unit of election administration (the New England town states, Michigan and Wisconsin, Alaska, and DC), so everything here is conditional on the county-administered model.
Coverage is low, and it clusters
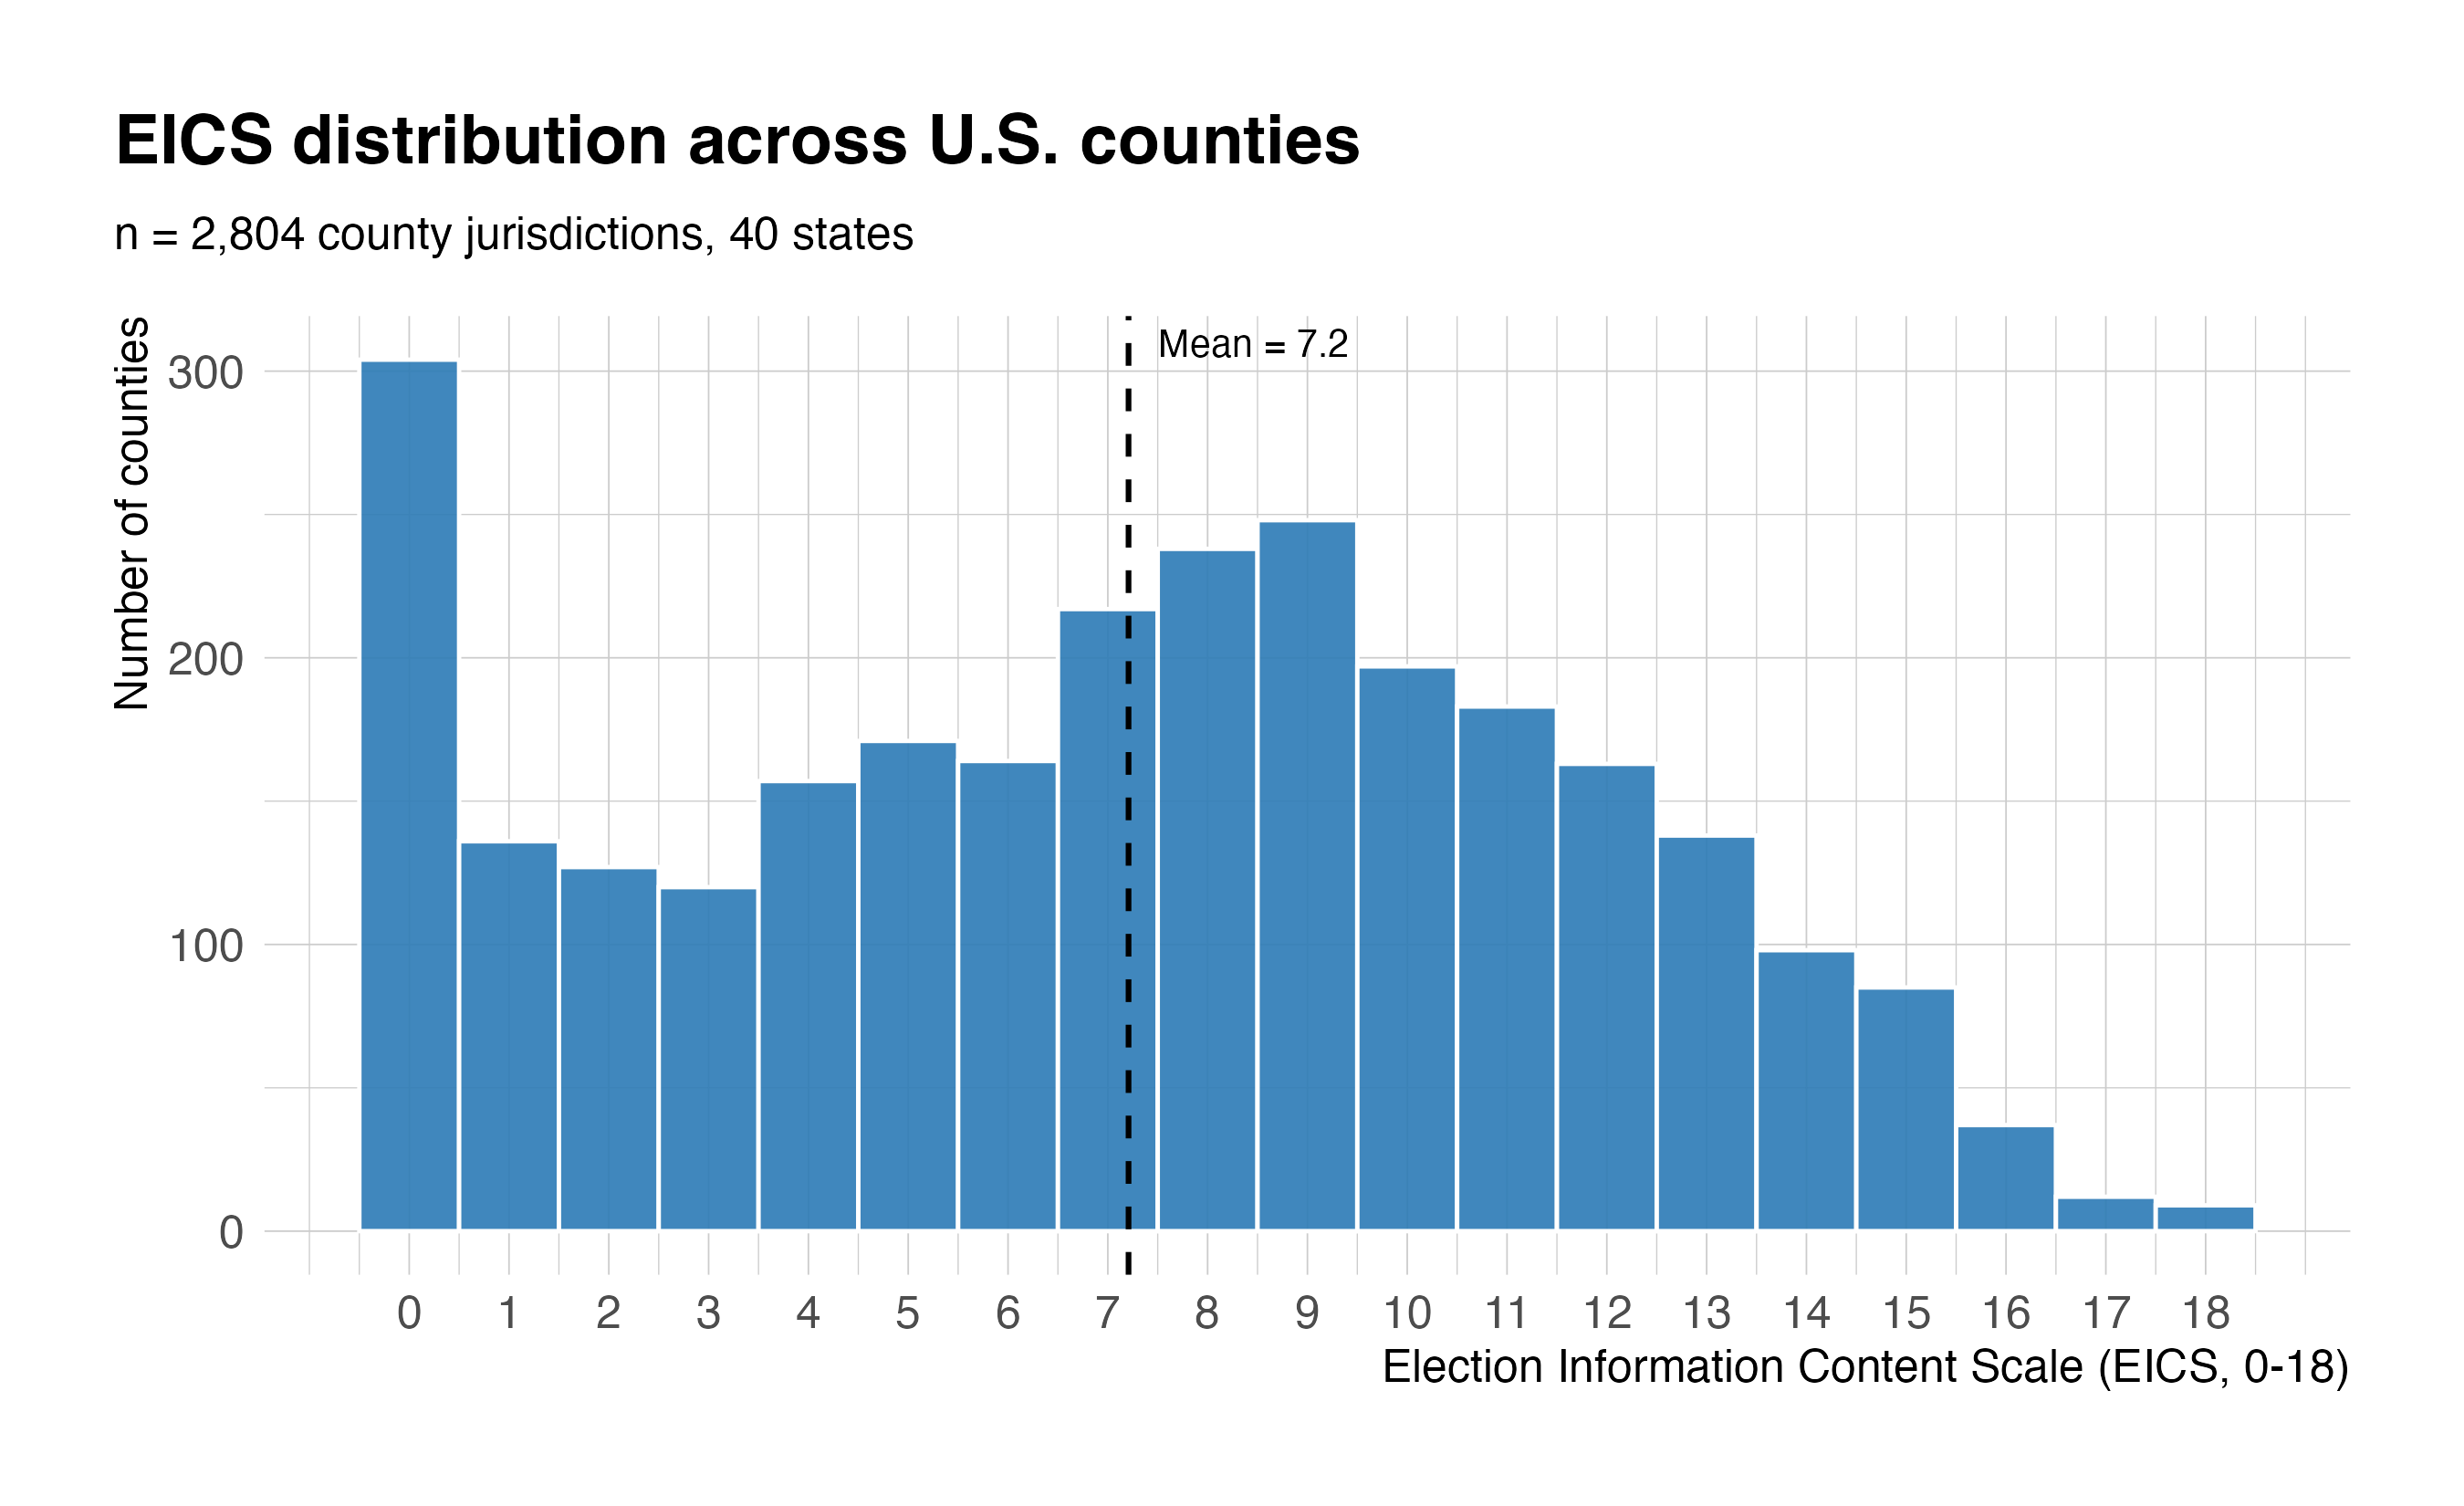
The average county provides 7.2 of 18 items, and the distribution isn’t a smooth normal. It’s more bimodal with a tall spike at zero and a second mode around eight or nine. About 11% of counties score zero. Some have no identifiable election site at all; others have a site that carries none of the 18 items. The top is thin: only 22 counties (0.8%) score 17 or 18. The modal county provides a core set of old, foundational items (registration, polling place, results, absentee) and nothing newer.
Three forces organize the rest of the variation, and they pull in different directions.
A national floor on the “new stuff”
The post-2020 items are scarce almost everywhere. Only 22% of counties give voters a way to track a mail ballot, 10% mention felon-rights restoration, and 4% provide a signature-cure form. Local information simply hasn’t kept up with how people vote now, and that shortfall barely varies across the country. It’s a universal gap, not a rural one.
A state ceiling
Much of the variation occurs at the state level. Mean coverage runs from 14.6 in Florida down to 1.1 in Oklahoma, a 13.5-point spread that’s wider than a full standard deviation of the county distribution. A regression with nothing but state fixed effects gets R² = 0.47: about half of all county-level variation is just between states. That points at state-level institutions (statewide templates, mandates, the capacity a secretary of state’s office pushes down to counties), but sorting out which of those drives it is still open.
The rural gradient, and why it’s mostly about size
Here’s the part that belongs in Rural Notes. Coverage does decline with rurality. Metro counties average 9.1 on the scale, nonmetro-urban 7.3, and rural counties 5.0. The gradient is continuous across the Index of Relative Rurality, and it holds within states: 36 of 38 states with enough counties show the expected negative slope. By every descriptive cut, more rural counties provide less.
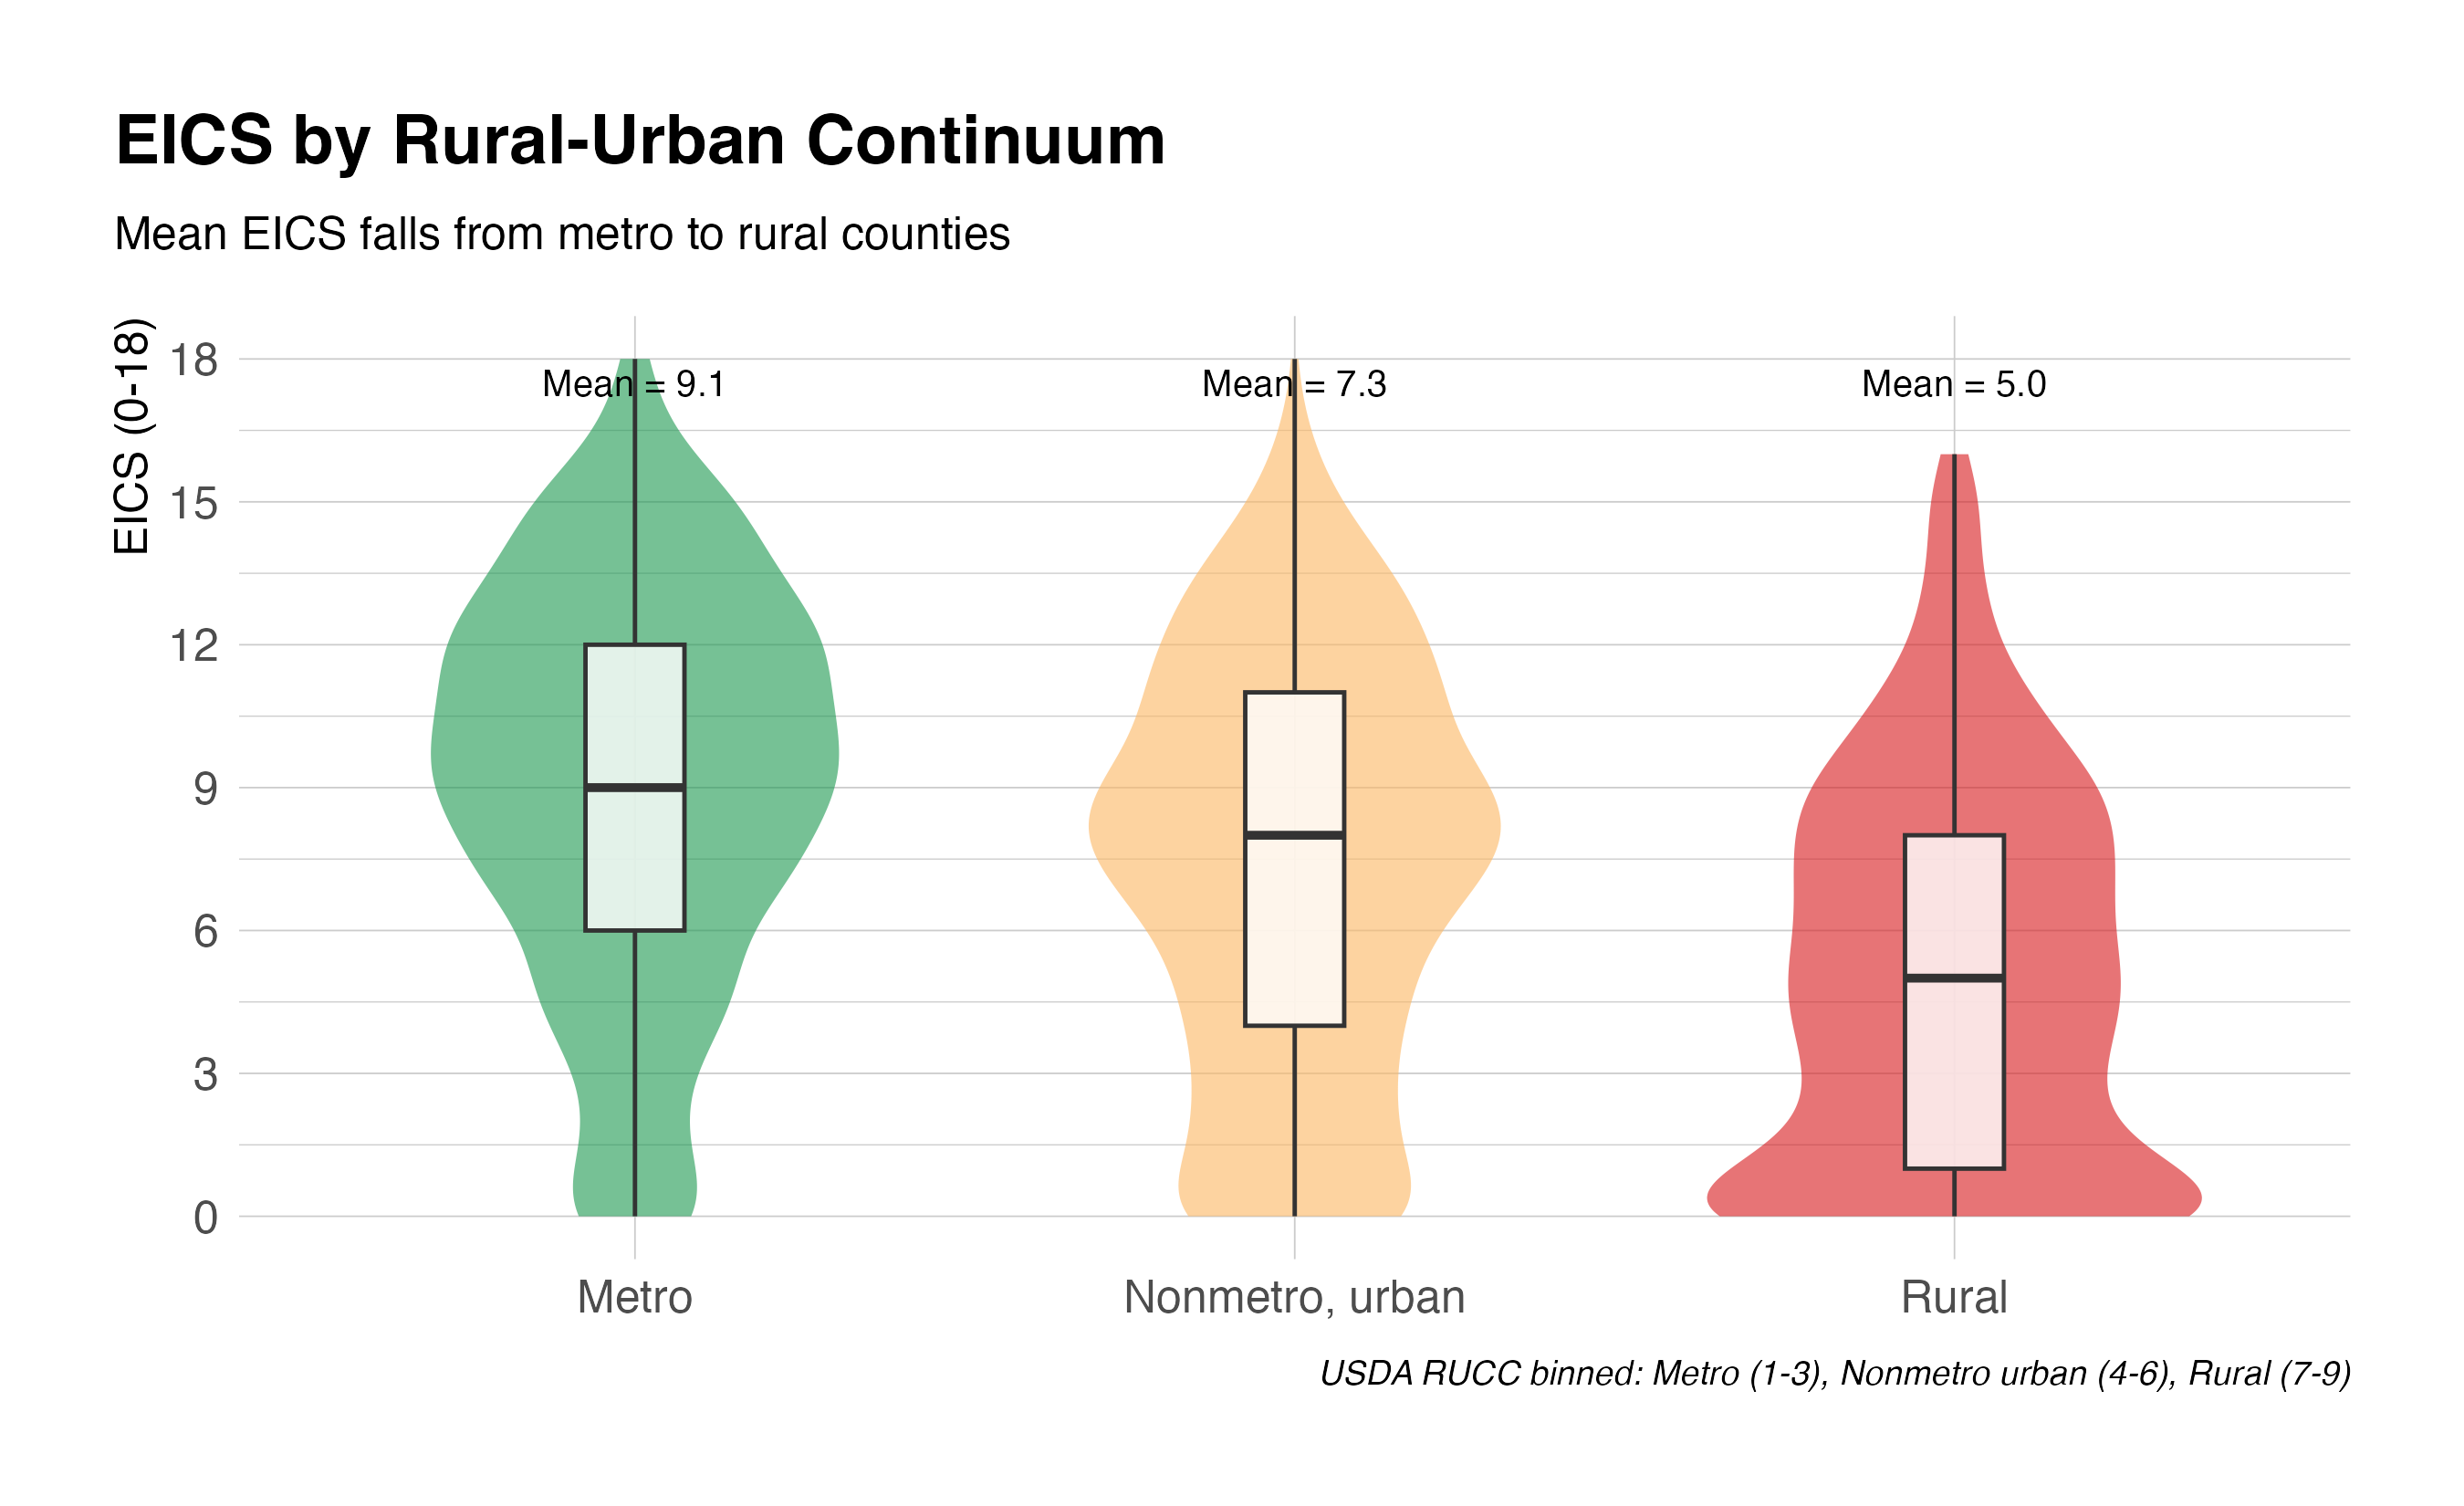
But the raw gap is mostly compositional. In a bare bivariate specification rural counties sit 4.1 points below metro. Add state fixed effects and it’s −3.45. Add the demographic and partisan controls and it collapses to −0.81, with the nonmetro-urban gap vanishing entirely. About three-quarters of the rural deficit was never really about rurality. It was about scale.
What absorbs it is log(population), the single strongest predictor in the model: a ten-fold larger county provides about 2.2 more EICS items, holding everything else constant. That’s a fixed-cost story. A bigger jurisdiction can amortize dedicated IT staff, a maintained content-management system, and the ongoing work of keeping a site current over a larger pool of voters. Rural places are, by definition, the small and sparse ones, so scale is the channel rurality mostly runs through here.
This is exactly the kind of thing I hope to consider in this rural notes series. The IRR is a clean, useful continuous measure, but it correlates −0.88 with log(population), and population alone explains about three-quarters of its variance. If you drop the IRR and population into the same model you’ve double-counted size and called part of it “rurality.” So we use categorical RUCC together with log(population) whenever we want to ask how much of the gap is scale, and we never put IRR and population in together. Same finding, different measure, a different story about why.
Infrastructure or content?
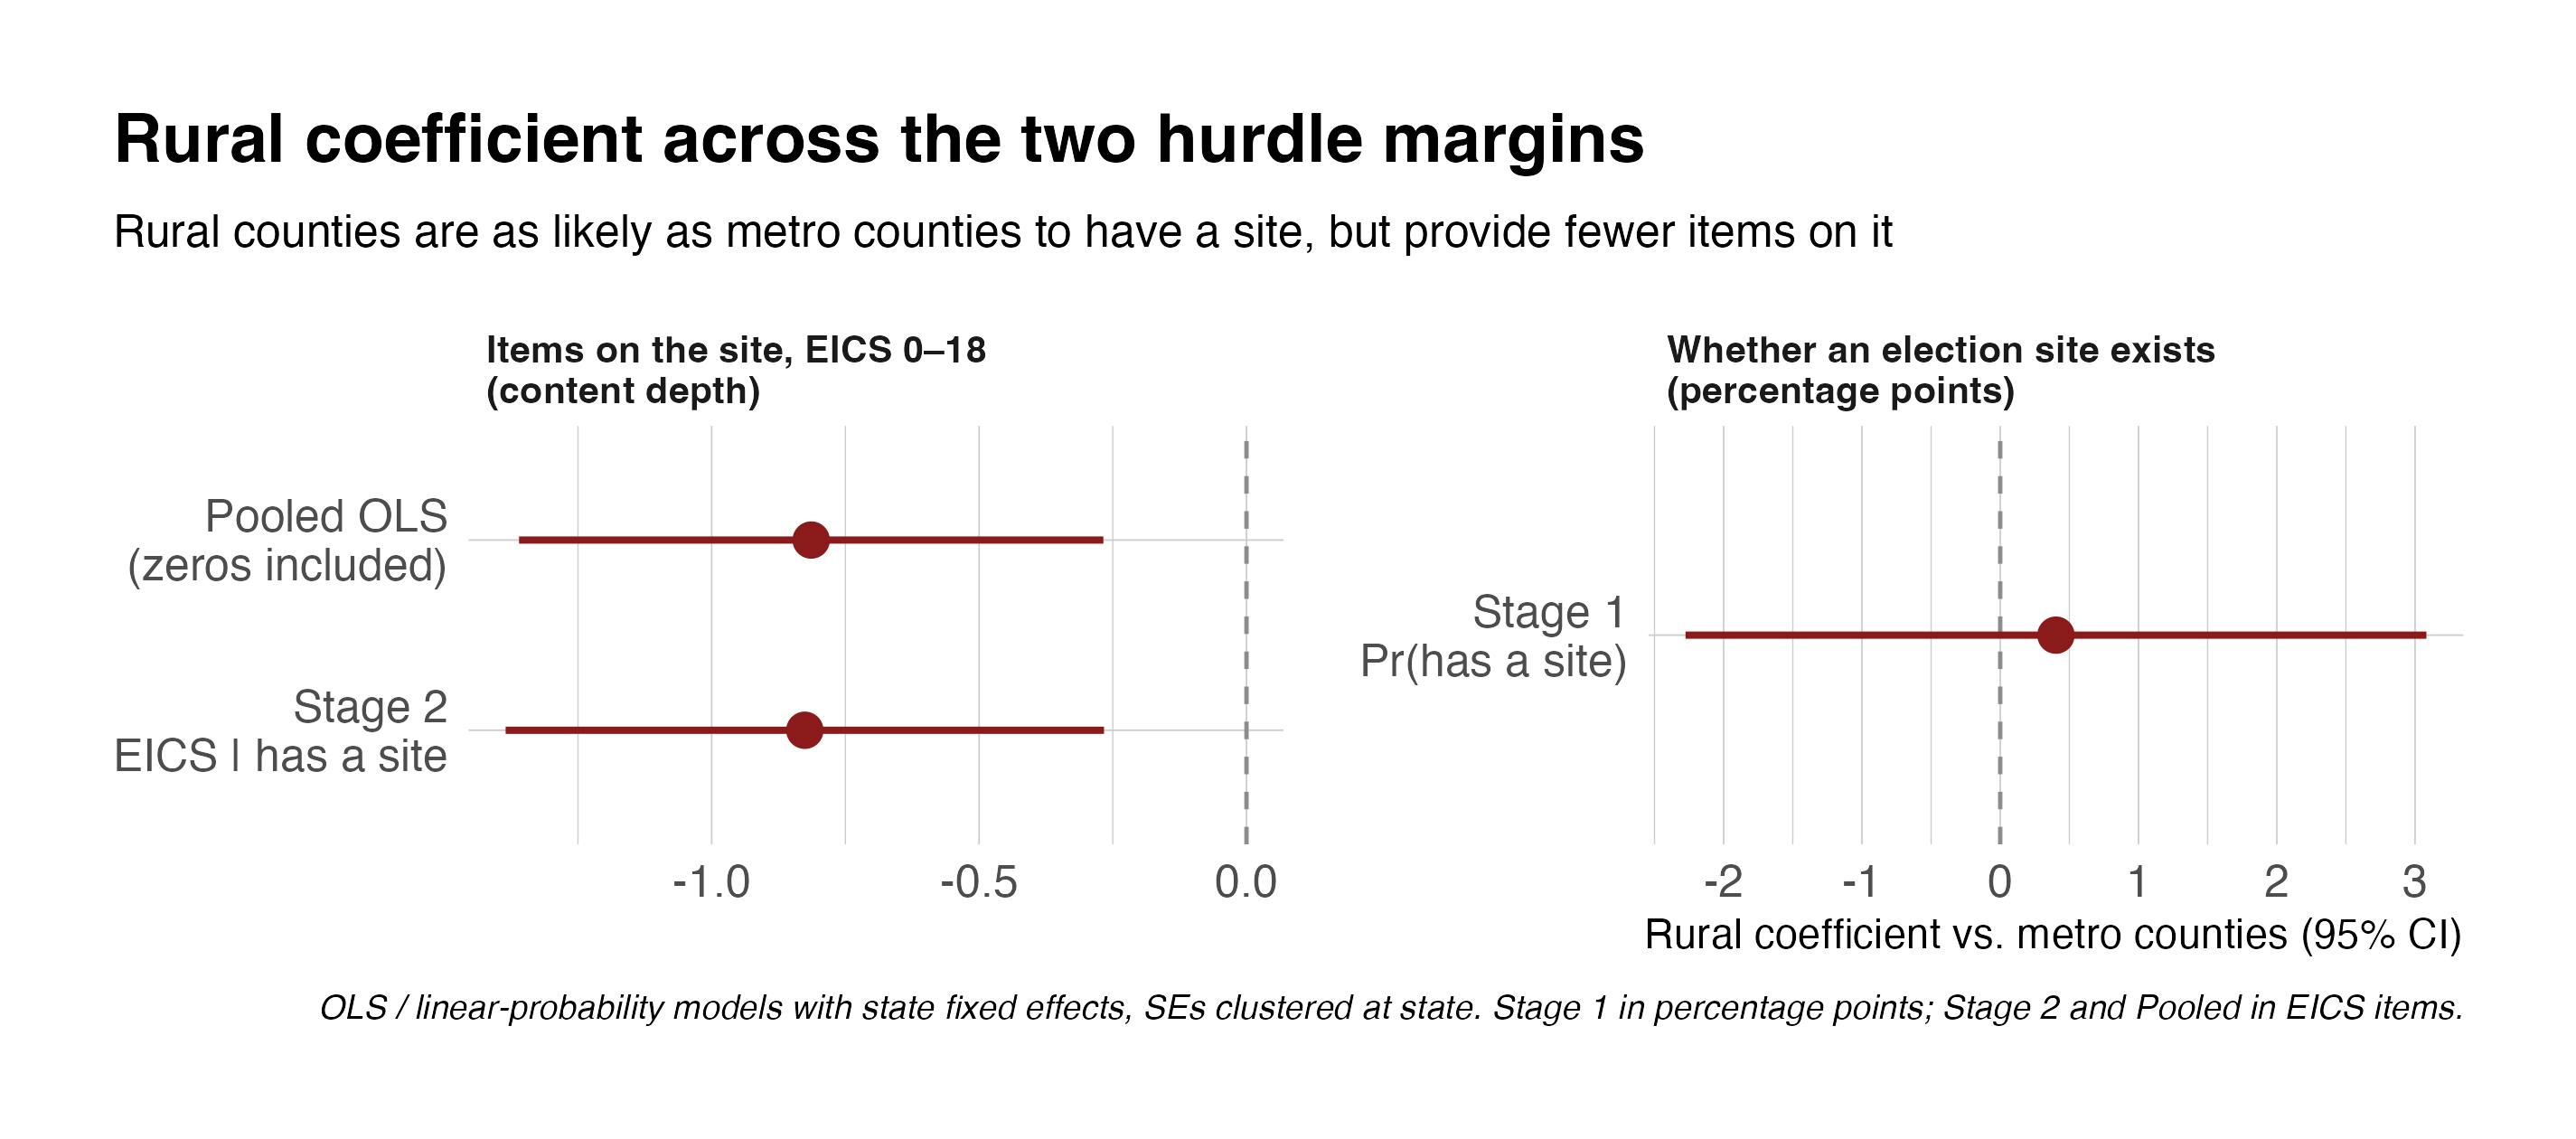
Because no-website counties enter at zero, the rural coefficient could mean two very different things: rural counties not putting up a site at all (an infrastructure problem), or rural counties running thinner sites (a content problem). Those call for different fixes, so we split them with a two-stage hurdle.
They separate cleanly. On the question of whether a county has an election website at all, the rural coefficient is a precise zero (+0.4 points, p = .76). Rural counties are no less likely to have a site. The entire rural deficit is on the second margin: content depth among counties that already have a site (−0.83, essentially identical to the pooled estimate). The gap isn’t that rural counties can’t get online. It’s that the ongoing work of filling a site out tracks capacity, and capacity tracks size.
And the residual rural gap that survives the controls isn’t evenly spread either. Fit one model per state and the median state’s rural gap is just −0.24; only three states (Tennessee, Kentucky, North Dakota) show a significant rural deficit after controls. What’s left concentrates in foundational items (results, poll-worker applications, schedules, the polling-place locator) in a handful of states, not a nationwide rural divide. The post-2020 items show no rural gap at all, but only because metro counties don’t provide them either. The national floor leaves nothing to lag behind.
What I take from this
Three patterns, three different problems:
- The national floor on post-2020 information is a universal failure that doesn’t care about urbanicity. Closing it needs a national push.
- The state ceiling is the biggest single source of variation, and it’s the most promising thing left to explain.
- The rural gradient is real but mostly a gradient in county size, with a small rural-specific remainder in foundational items in a few states.
Caveats
This is preliminary, and a few measurement calls are genuinely unresolved (these are where we most want feedback):
- The county site, or the voter’s whole information environment? In high-capacity states the secretary of state’s portal may serve voters a tracker or lookup the county itself doesn’t. Scoring the county site alone answers “what does the county provide?”; crediting the state tool answers “can the voter find it?” We may report both.
- A denominator for the post-2020 items. A county with no signature-cure page in a state that has no signature-cure process is currently scored the same as one that should have it and doesn’t. The floor may mix real gaps with legal non-applicability. The fix is a state-law crosswalk.
- A scale, or a checklist? The EICS is an unweighted sum of 18 binary items. We haven’t validated that they tap one construct, and a polling-place locator and a felon-rights page probably aren’t worth the same point.
We hope to update and expand this project as time and resources allow.