How does rural matter for election administration?
A look at my ESRA 2026 poster on rurality measurement and how counties run elections
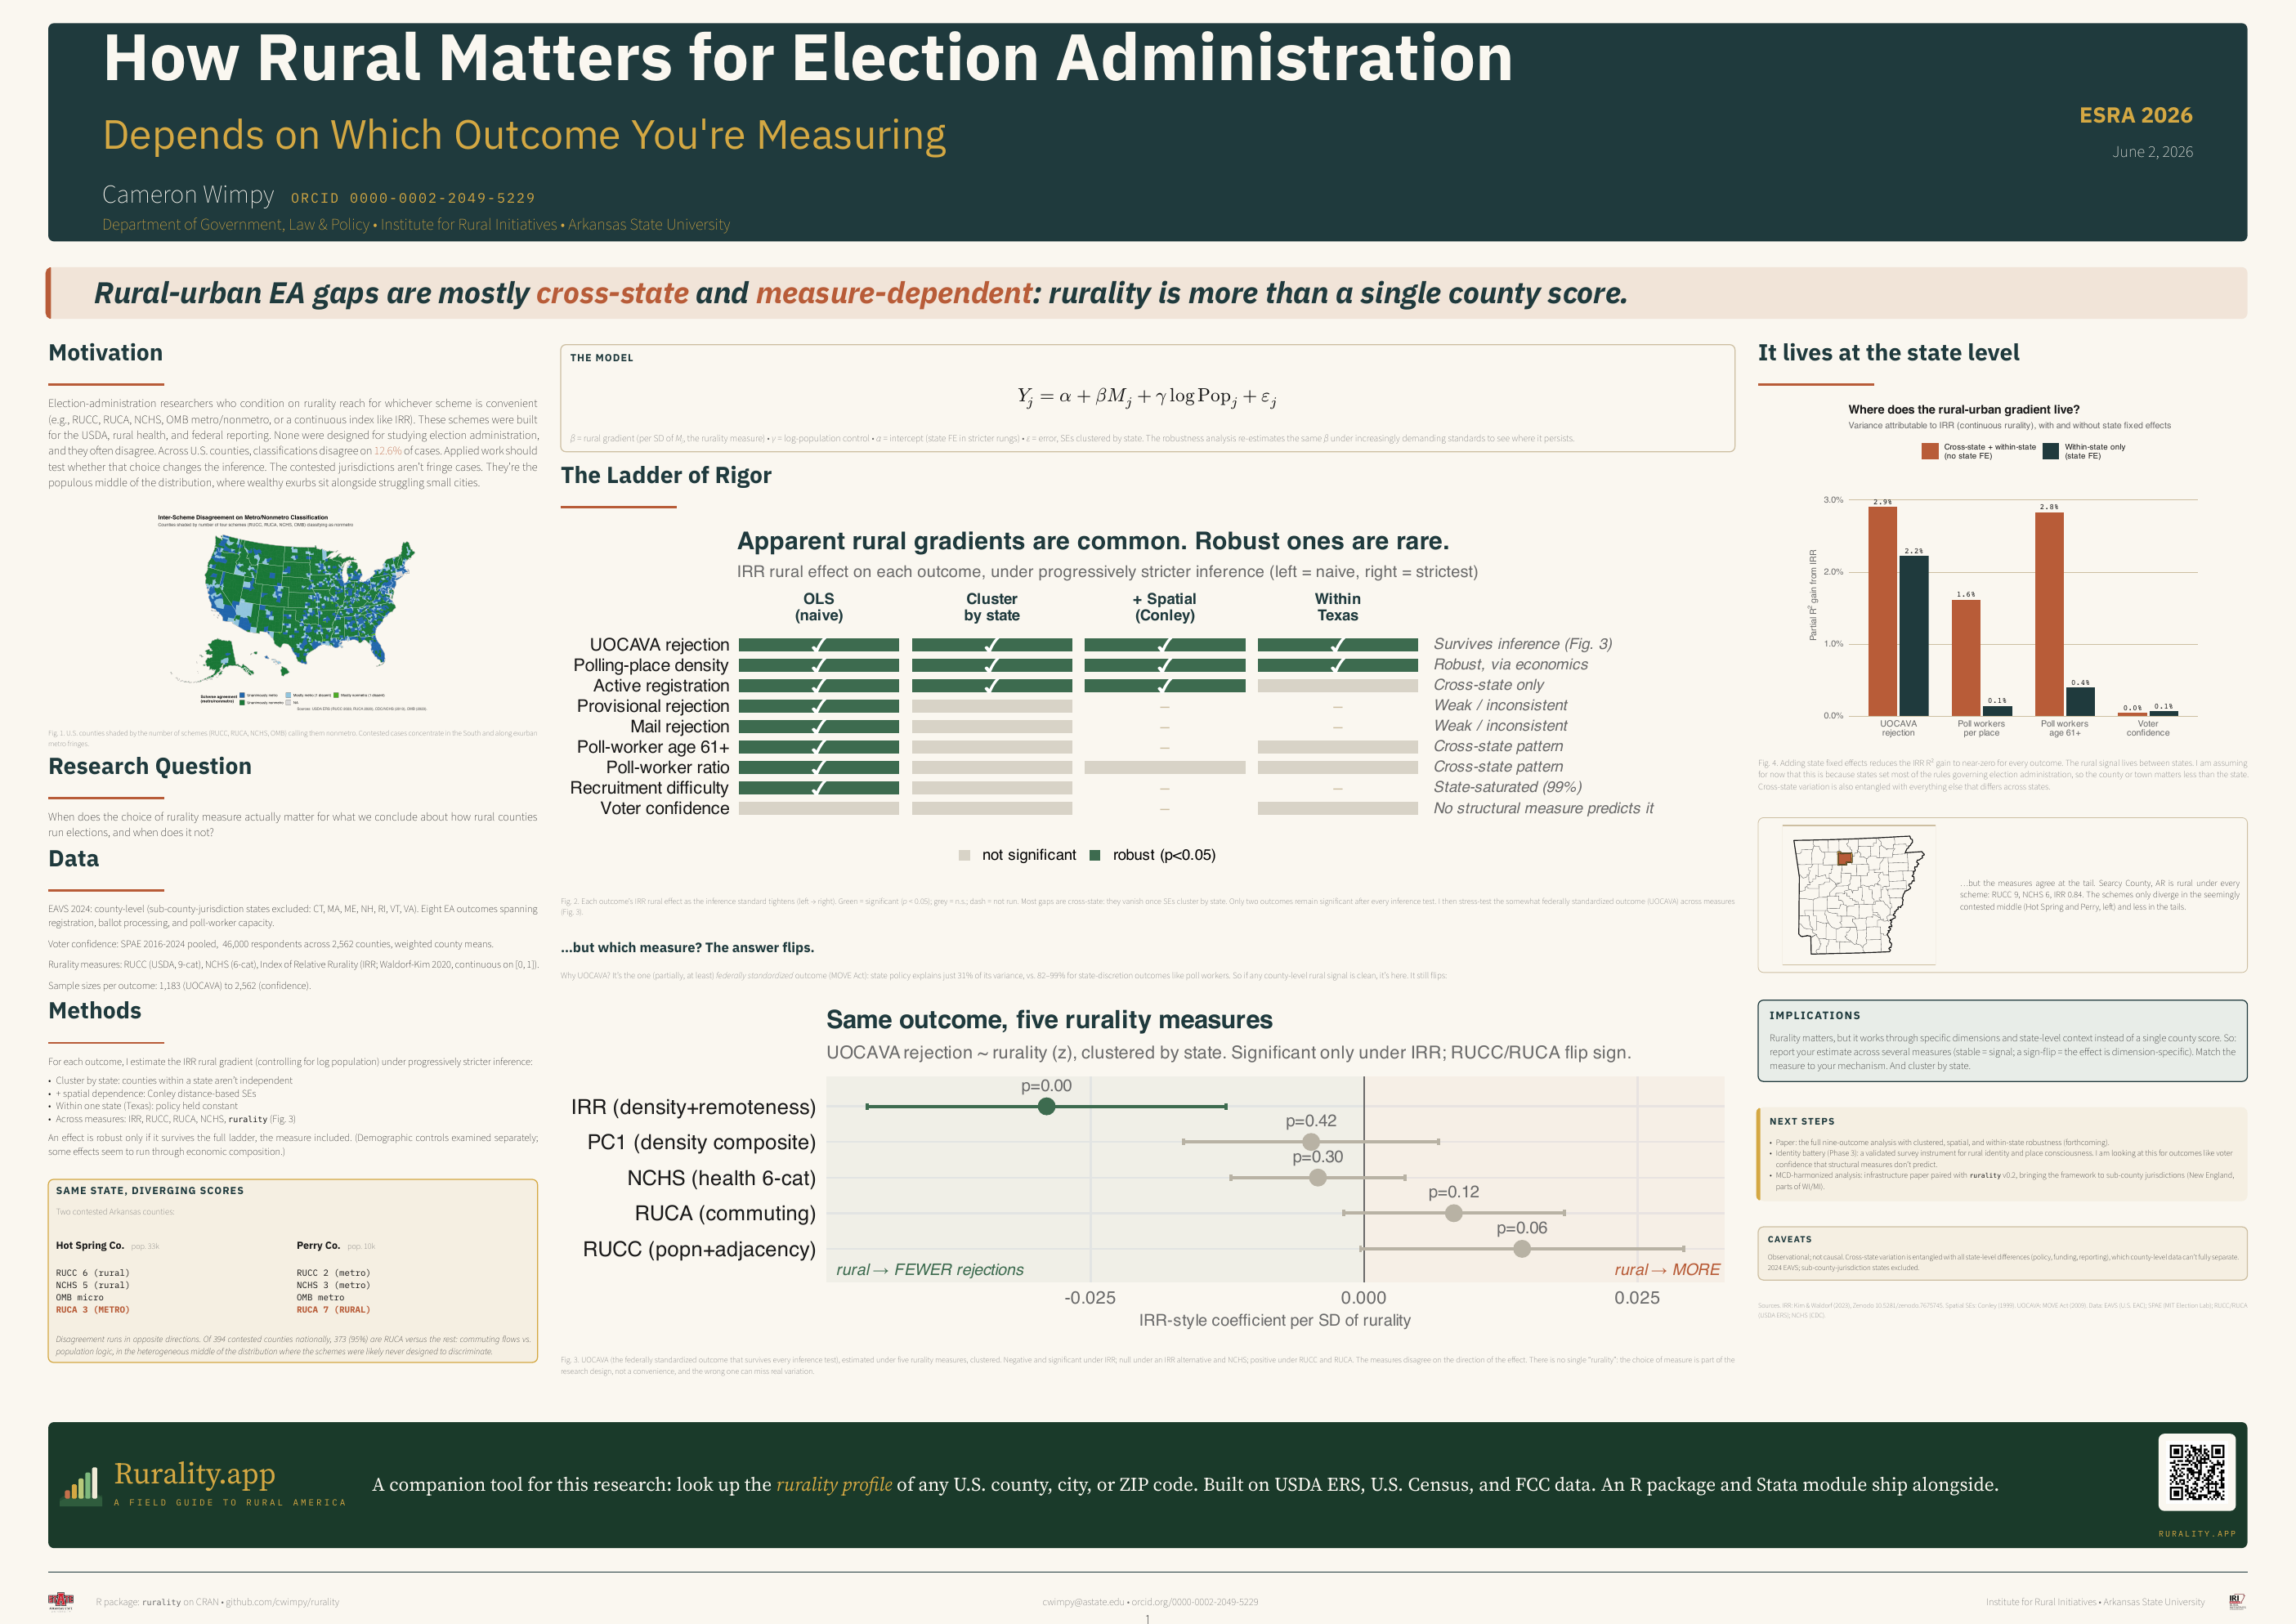
This is a post in Rural Notes, my working-notes series on rural measurement and rural political behavior. It is an overview of a poster I am presenting today at ESRA 2026, so it is very much research-in-progress. The downloadable poster is below, but I hope to have a related working paper posted soon.
The setup
If you do applied work on rural America and you need to condition on rurality, you reach often for whatever classification is handy: USDA’s Rural–Urban Continuum Codes (RUCC), the Rural–Urban Commuting Areas (RUCA), the NCHS urban–rural scheme, OMB’s metro/nonmetro line, or a continuous index like the Index of Relative Rurality (IRR). These were built for the USDA, for rural health research, and for federal reporting. None of them were designed for studying how counties run elections, and they often disagree.
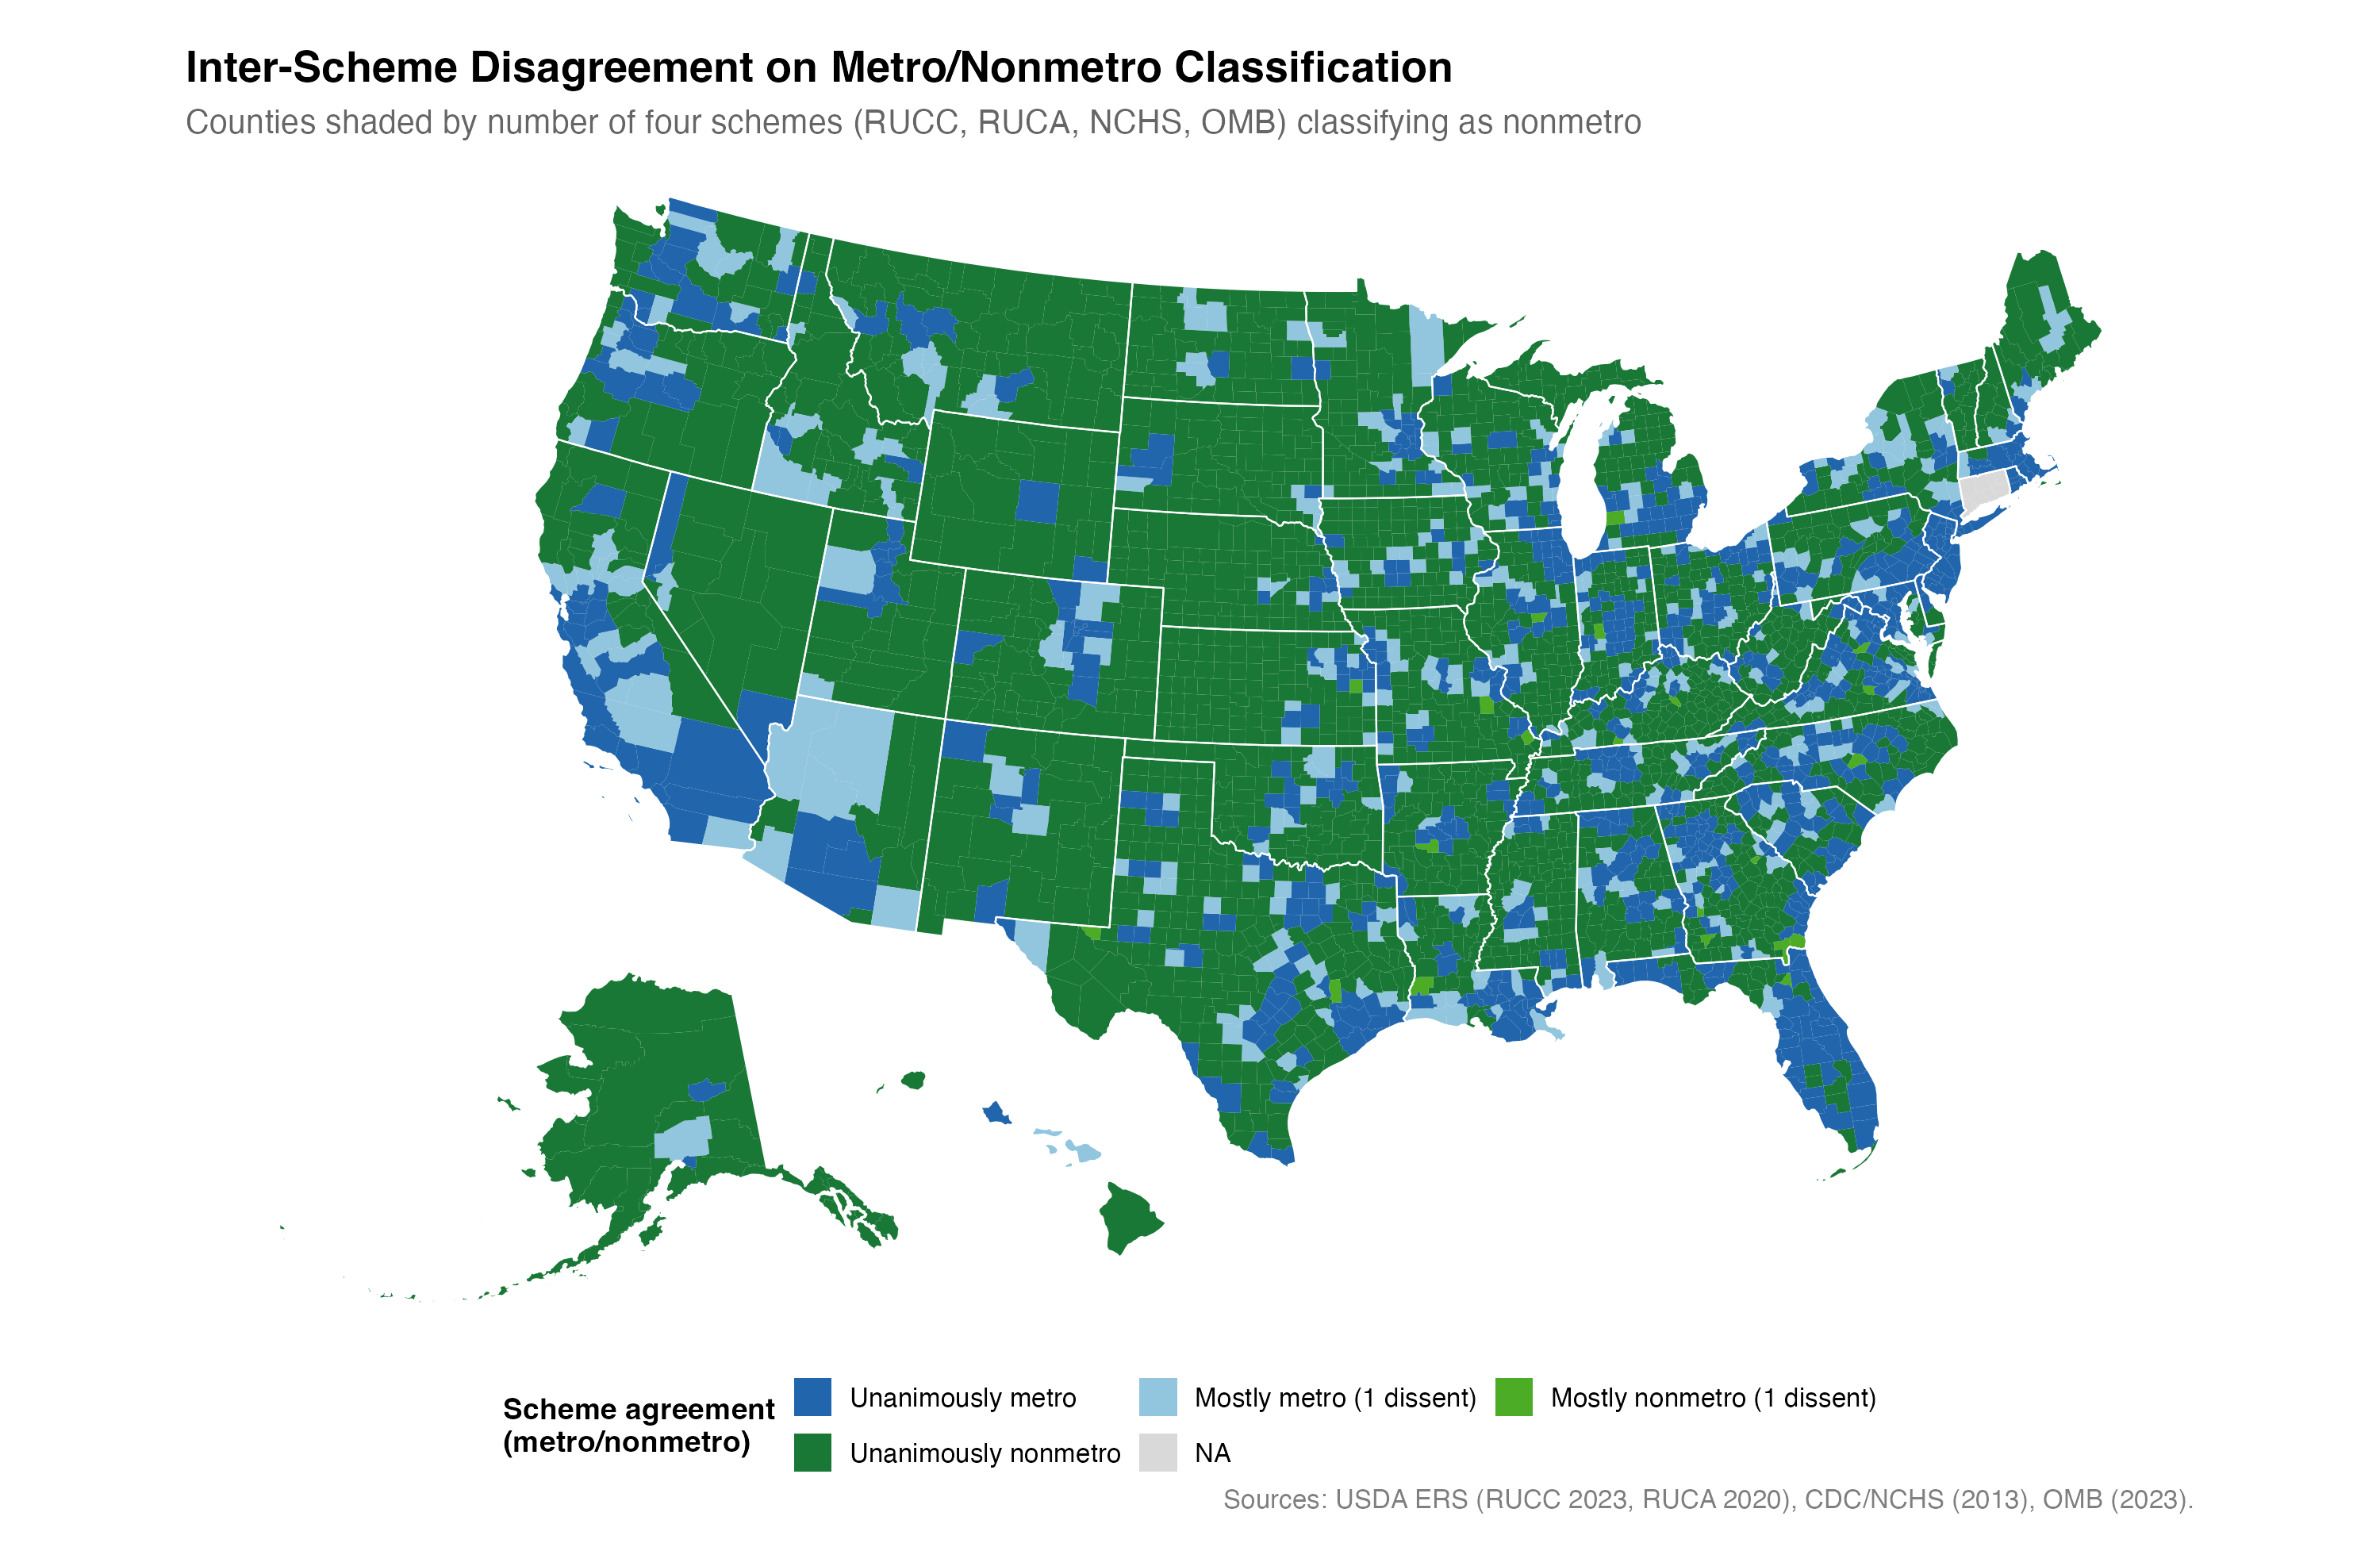
How often? Across U.S. counties, the four categorical schemes disagree on 12.6% of cases. That sounds small until you look at where the disagreement lives. The contested counties are not fringe cases out at the edge of the distribution. They sit in the populous middle, where wealthy exurbs share a category boundary with struggling small cities.
So I ask a simple question in the poster: when does the choice of rurality measure actually change what we conclude about how rural counties run elections, and when does it not?
What I did
I pulled four election-administration outcomes from the 2024 EAVS (spanning registration, ballot processing, and poll-worker capacity), plus county-weighted voter confidence from the pooled SPAE 2016–2024 (about 46,000 respondents across 2,562 counties). I excluded the sub-county-jurisdiction states where county-level analysis doesn’t make sense (CT, MA, ME, NH, RI, VT, VA).
For each outcome I estimated the rural gradient, controlling for log population, and then put it through a ladder of progressively stricter inference:
- cluster the standard errors by state, since counties within a state aren’t independent;
- add spatial dependence with Conley distance-based standard errors;
- re-estimate within a single state (Texas), holding policy constant;
- and re-estimate across rurality measures (IRR, RUCC, RUCA, NCHS, and the composite from my
ruralitypackage).
An effect only counts as robust if it survives the whole ladder, including the measure swap.
The two findings that matter
Most rural-urban gaps are cross-state. They look real in a naive specification, then vanish the moment the standard errors cluster by state. Adding state fixed effects drives the rural R² gain to near zero for every outcome. The rural signal, where there is one, lives between states, not within them. That makes some sense: states set most of the rules governing election administration, so the state matters more than the county. It also means the cross-state variation is tangled up with everything else that differs across states, which county-level data can’t fully separate.
For the one outcome that survives, the answer flips depending on the measure. Only UOCAVA (overseas and military ballot handling) makes it through every rung of the ladder. It’s also the one outcome that is federally standardized, via the MOVE Act, so state policy explains just 31% of its variance versus 82–99% for state-discretion outcomes like poll-worker ratios. If any county-level rural signal is clean, it should be here. And yet: the effect is negative and significant under IRR, null under NCHS and an IRR alternative, and positive under RUCC and RUCA. The measures disagree on the direction of the effect.
That is the headline. There is no single “rurality.” The choice of measure is part of the research design, not a convenience, and picking the wrong one can hide real variation or manufacture a result that isn’t there.
Why the measures diverge where they do
The schemes mostly agree out in the tails. Searcy County, Arkansas is rural under everything: RUCC 9, NCHS 6, IRR 0.84. The disagreement is concentrated in the contested middle. Two more Arkansas counties make the point:
- Hot Spring County (pop. 33k): RUCC 6 (rural), NCHS 5 (rural), OMB micro, but RUCA 3 (metro).
- Perry County (pop. 10k): RUCC 2 (metro), NCHS 3 (metro), OMB metro, but RUCA 7 (rural).
The disagreement runs in opposite directions for the two counties. Of 394 contested counties nationally, 373 (95%) are RUCA against the rest: commuting flows versus population logic, fighting over exactly the heterogeneous middle of the distribution that these schemes were never built to tell apart.
What I take from this
A few practical implications for anyone conditioning on rurality:
- Report your estimate across several measures. If it’s stable, you have at least some signal. If it flips sign, the effect is dimension-specific and you need to say which dimension.
- Match the measure to your mechanism. Commuting-based, density-based, and population-based schemes are answering different questions.
- Cluster by state. A lot of apparent rural effects are really cross-state variation wearing a rural costume.
And the standard caveats apply: this is observational, not causal; the cross-state variation is entangled with all the state-level differences county data can’t separate; and it’s the 2024 EAVS with sub-county states excluded.
What’s next
- The paper: the full nine-outcome analysis with clustered, spatial, and within-state robustness (forthcoming).
- An identity battery: a validated survey instrument for rural identity and place consciousness, aimed at outcomes like voter confidence that the structural measures don’t predict.
- Sub-county work: an analysis harmonized to minor civil divisions (MCDs, the towns and townships that run elections in place of counties in some states), paired with
ruralityv0.2. This brings the framework to the sub-county jurisdictions in New England and parts of Wisconsin and Michigan that the county-level analysis has to drop.