Introducing rurality.app: A Field Guide to Rural America
A web companion to the rurality package
This is the opening post in Rural Notes, a working-notes series on rural measurement and rural political behavior. My posts in this series will include downloadable PDFs and, where appropriate, replication code.
A field guide to rural America
rurality.app is a new web companion that I created as a complement to my rurality R package. It takes the same county- and ZIP-level rural–urban classifications that the package exposes to R users and puts them behind a browser interface that anyone (e.g., journalists, county officials, students, curious readers) can use without needing to work with R.
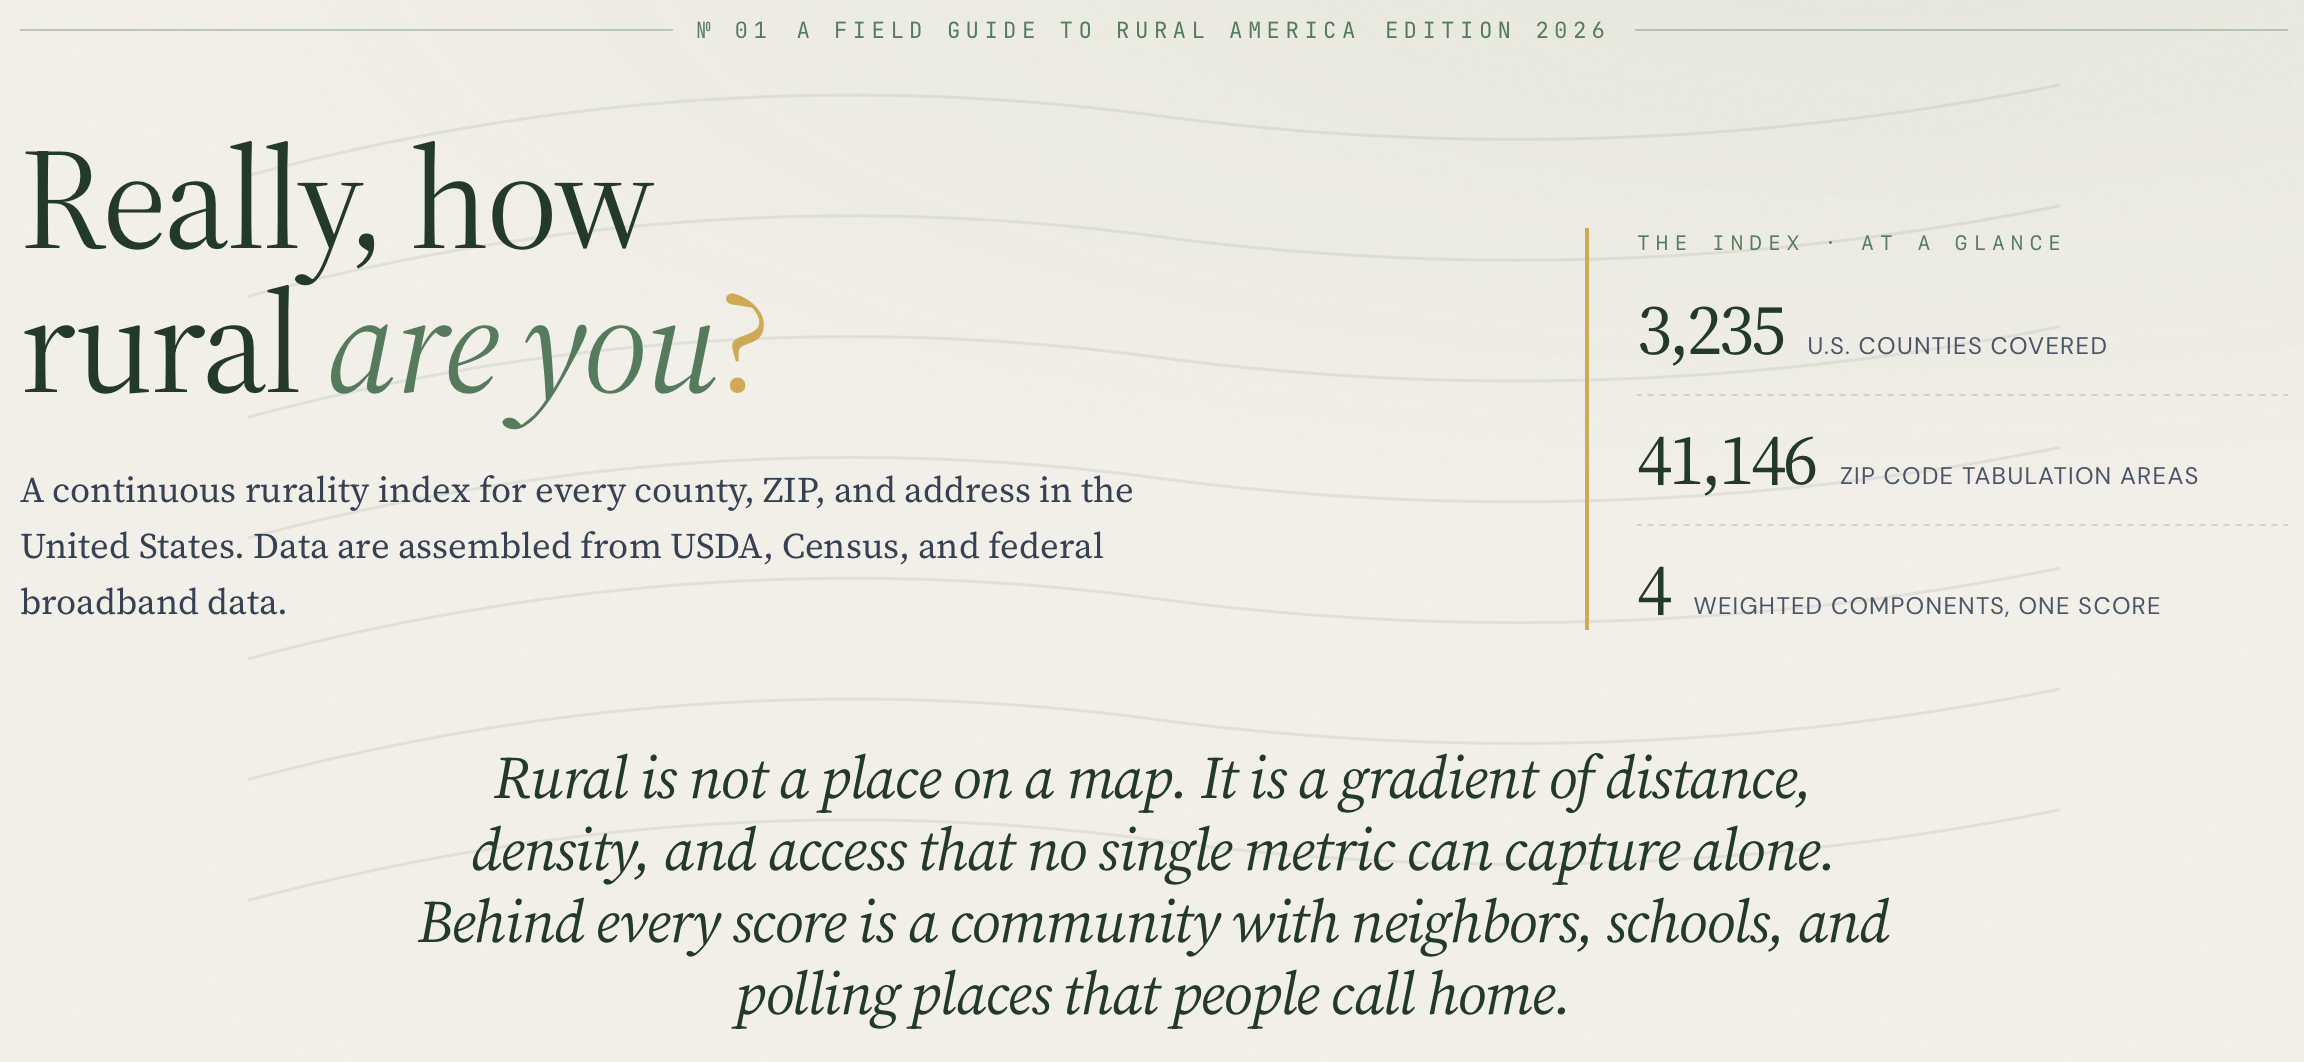
The site’s tagline is its premise: a field guide to rural America. I do not really envision this as a database. My hope is that it is an invitation to look more carefully at things you’d otherwise pass over. Rural America is not a single category, and the app is built to make that visible.
What you can do with it
- Look up any U.S. county or ZIP and see its RUCC, RUCA, and composite rurality score
- Browse a national map and select any location to learn more
- Compare up to five places side-by-side
- Download the full dataset
- Read short field-notes on what each measure captures and where it diverges from the others
- Download the field notes
Look up a place
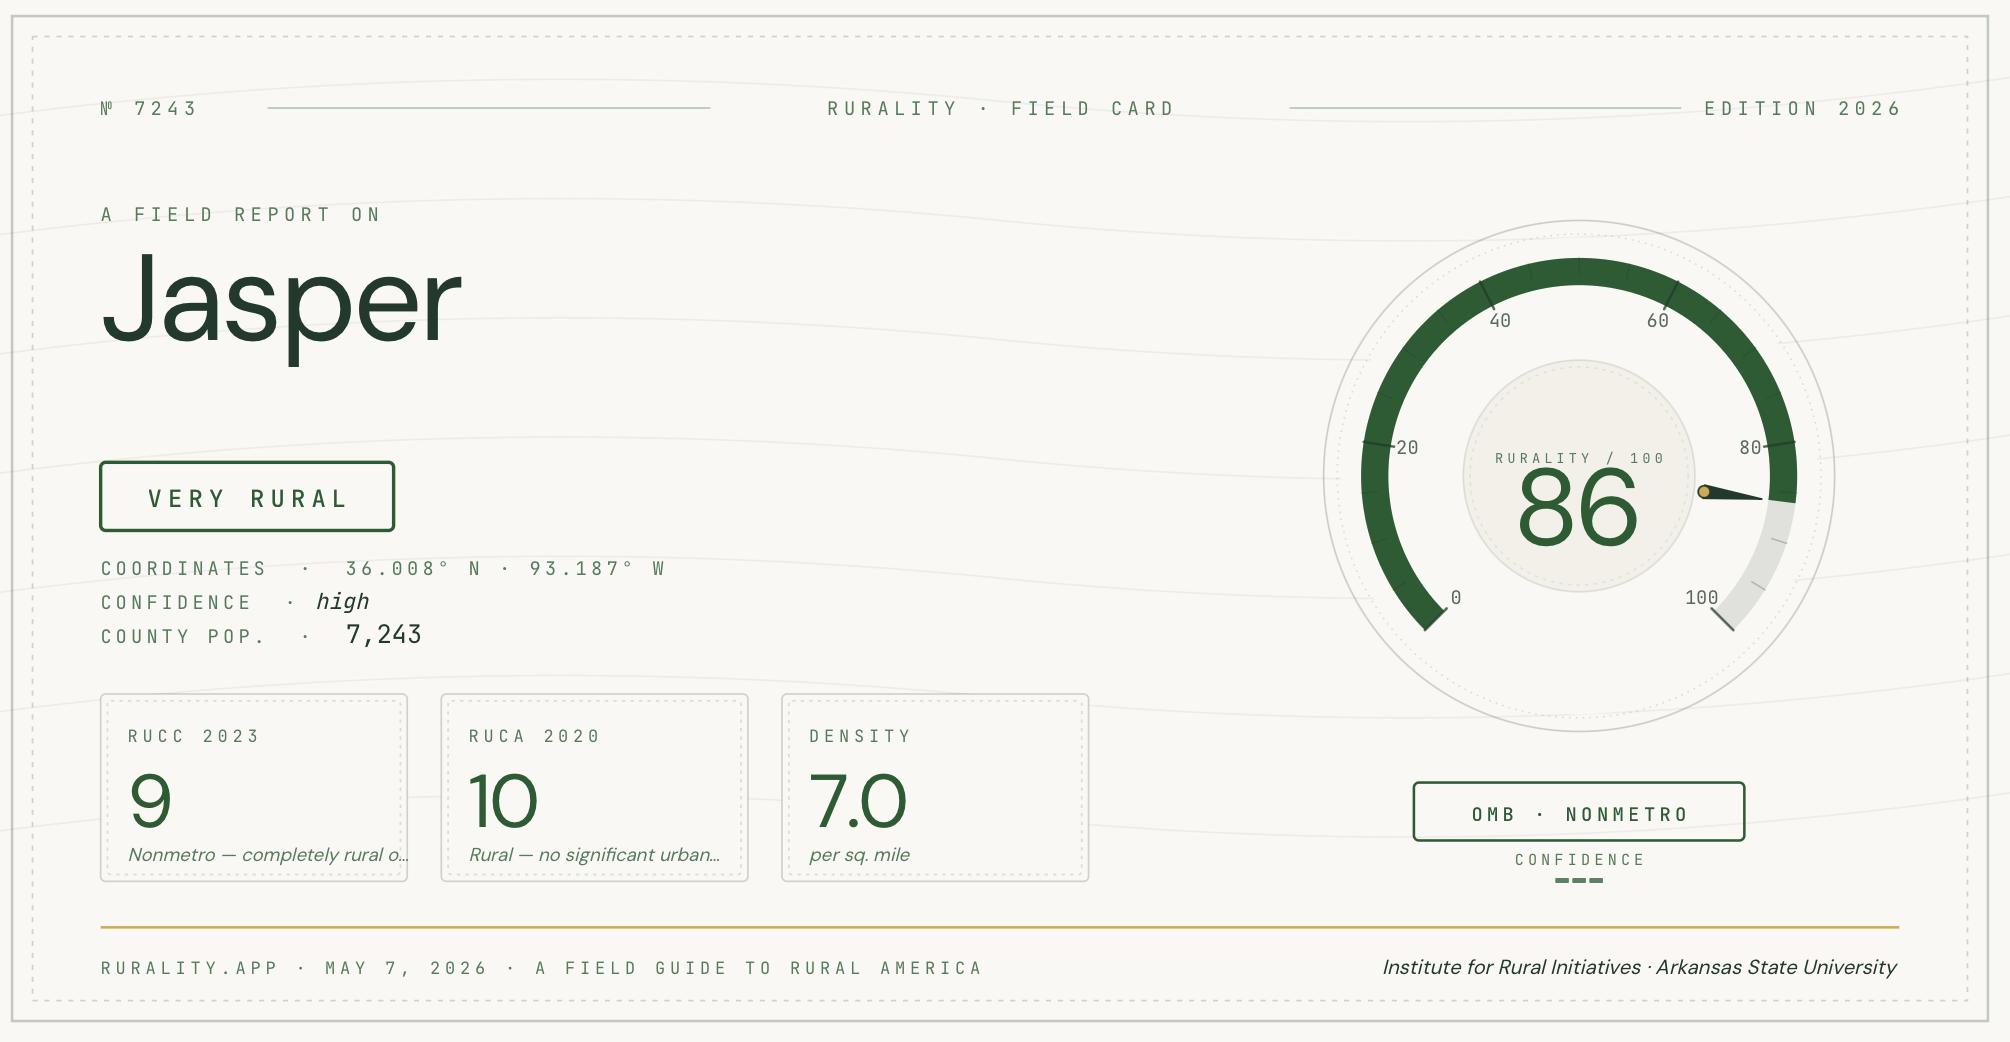
To look up a place, go to rurality.app and type a location into the search bar. You can also use your device’s GPS, with permission. Nothing is tracked intentionally; if you find otherwise, let me know. Once you pick a spot, you should get information about it fairly quickly. Below is the exportable field card for Jasper, AR.
See the national picture
You can also click on the map feature and simply pick out a spot. From either the map or the search, you can then learn all about the place using the dashboard. I plan to keep adding to this over time as I get the data cleaned and accessed through APIs.
For RUCC, specifically
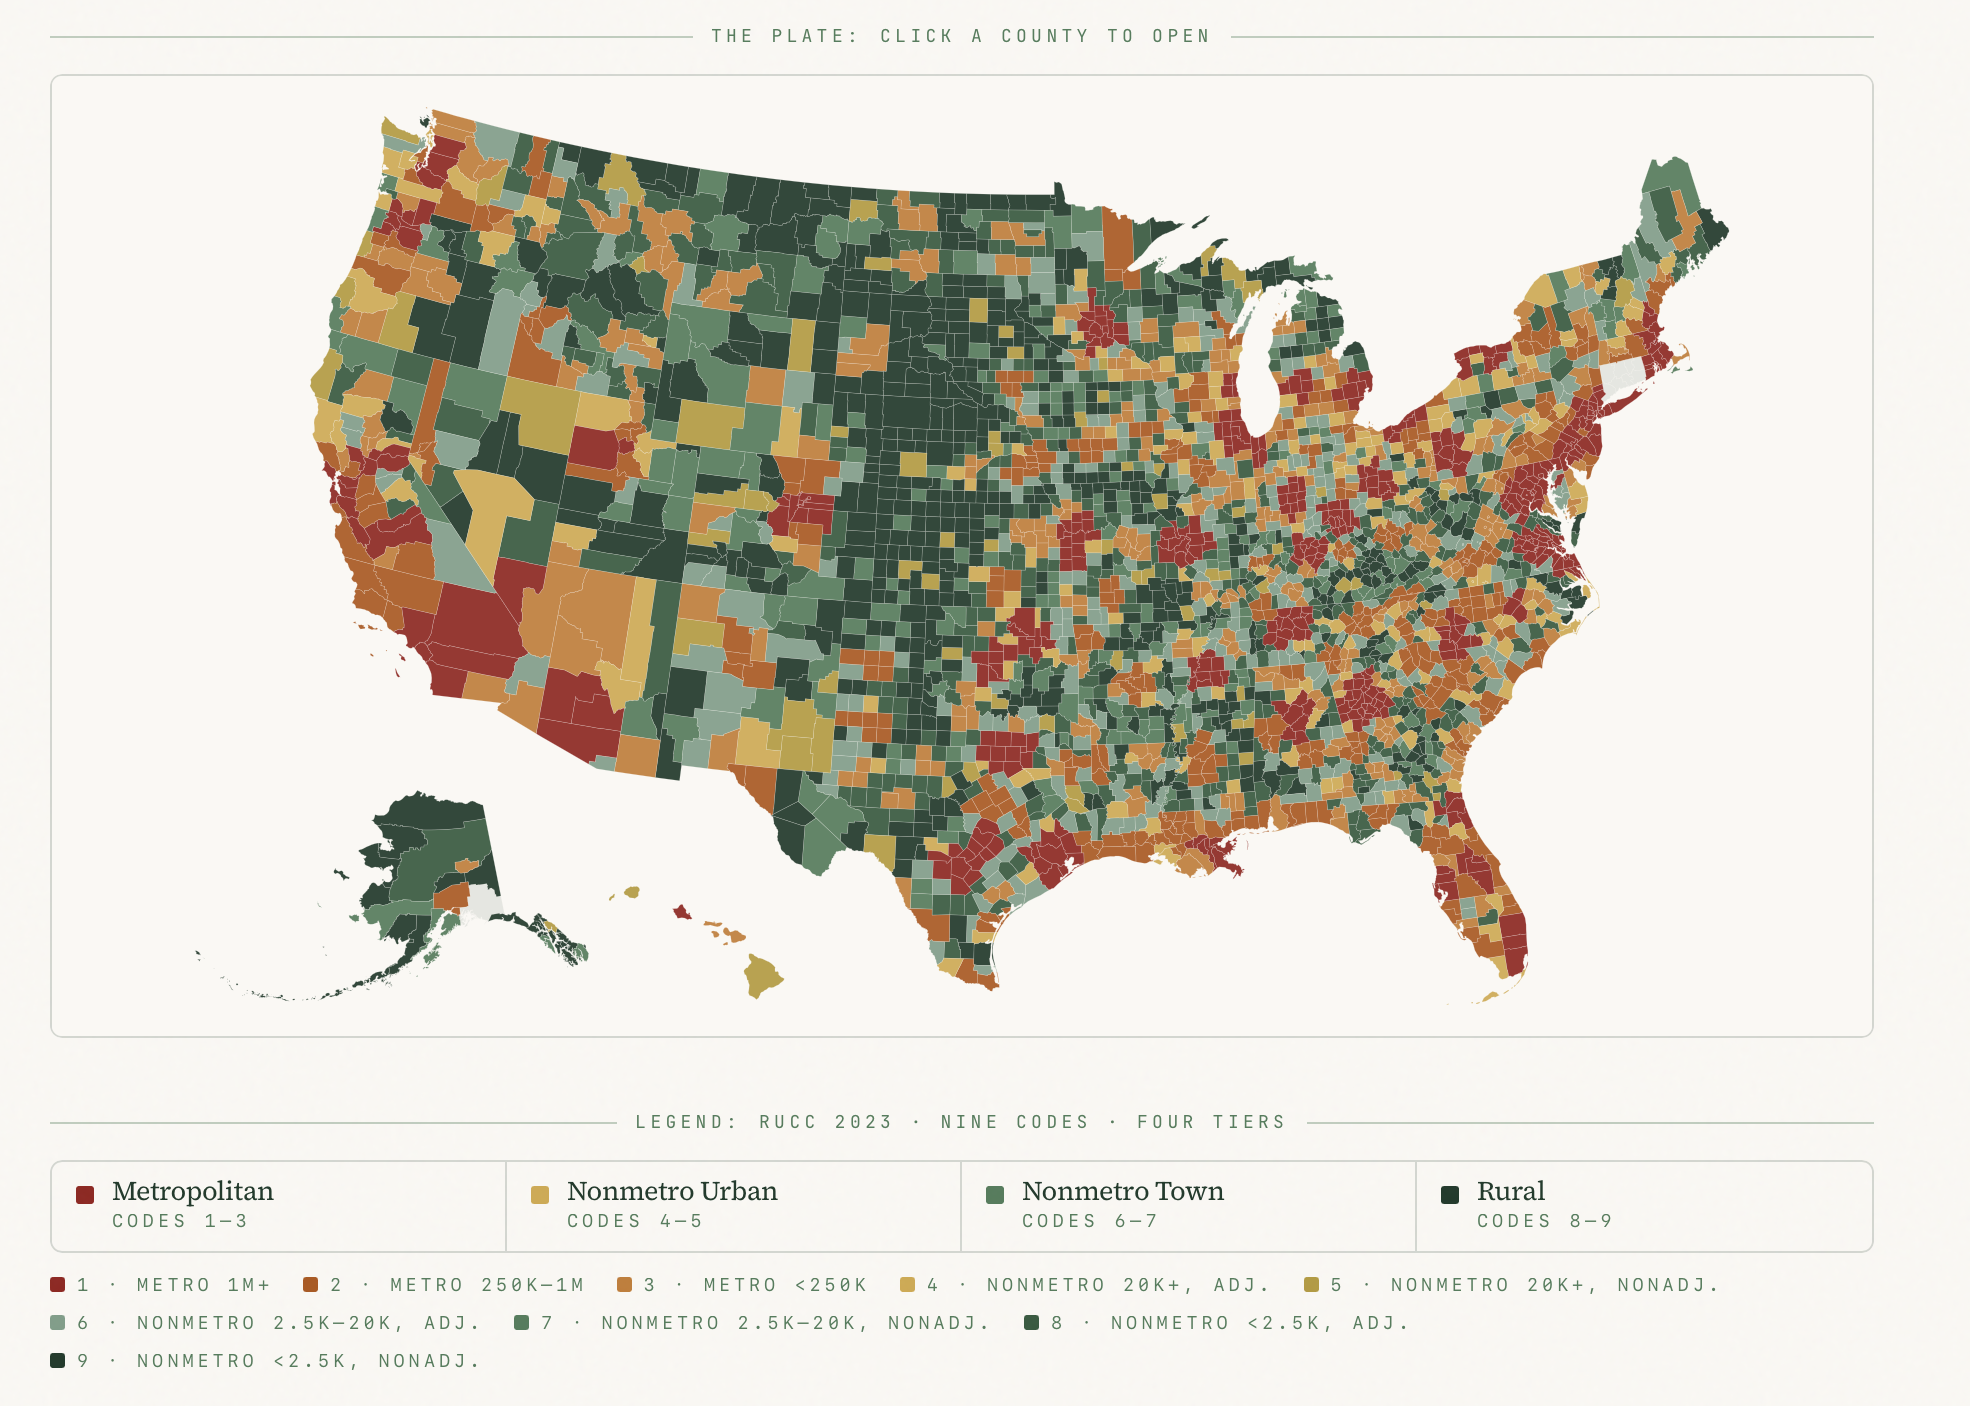
The US counties page provides an interactive map of the RUCC. Simply click on a county to learn more.
Read the measure, not just the value
Each measurement captures specific things. It is a good idea to understand what each one does, and does not capture. Many of the measures were developed for specific applications and need to be understood in that context. The measures also apply to different levels of geography. For example, the RUC codes will map to counties that may have metro centers but relatively rural areas otherwise. The RUCA codes, on the other hand, are mapped to the ZIP Code Tabulation Areas (ZCTAs), which are obviously much more granular than the whole county. The methodology page provides more details on this and links to the original source documentation.
Take the data with you
The safest place to fetch any of the included data may be the original sources! But, since that is not always easy, I included a “for researchers” page that allows you to download the data used in the app/package. I have done my best to make sure everything is cleaned and merged properly, but just note that I am not currently making any promises. This page also provides examples of using the R package. If you cite anything please cite the original sources. If you end up using my index please cite me, but again, do so knowing it is under development.
Why a web tool, not just a package
The rurality R package already does some of the heavy lifting for researchers. It includes USDA’s Rural–Urban Continuum Codes, Rural–Urban Commuting Area codes, and a composite rurality score under a single consistent interface. I am working to make sure these merge as cleanly as possible with county FIPS or local zip.
Most of the people who might benefit from looking up rural–urban classifications are not R users. They are reporters writing about a specific county, county officials trying to make sense of a federal funding formula that hinges on metro/non-metro status, students writing papers, and perhaps anyone who has ever read a story about “rural America” and wondered which rural America it was talking about. My hope is that rurality.app makes this an easier process.
I also have been working on expanding my research agenda on rural election administration, measurement, and public opinion. This selfish reason, as much as anything, is why I have created a new way to publicly document that effort. In Rural Notes (the series this post opens) I argue that a finding about rural America is only as good as the rurality measure that produced it. That argument is easier to make when the reader can spend two minutes on rurality.app and see for themselves how a single county can be “rural” under one classification and “metro-adjacent” under another.
The data underneath
Three layers, all keyed by FIPS or ZIP, all available in the rurality R package and rurality-stata:
- Rural–Urban Continuum Codes (RUCC 2023): USDA’s nine-point metro/non-metro scale, one row per county. This is one of the most accessible and (at least in my experience) one of the most commonly used measures since it neatly maps to counties.
- Rural–Urban Commuting Area Codes (RUCA 2020): USDA’s commuting-flow-based classification, finer-grained than RUCC, one row per ZIP code tabulation area.
- A composite rurality score: a continuous measure I built for situations where collapsing nine RUCC buckets into “rural vs. urban” throws away too much signal but keeping all nine as categorical dummies eats degrees of freedom. This one is a work in progress and should be used under that assumption.
The web app and the R/Stata packages are deliberately three faces of the same thing. If you look up a county on rurality.app, the values you see are the values you’d get from rurality_counties() in R. There is no hidden version, no proprietary score behind the web app, and the data will move forward in step when USDA releases new vintages.
Where it fits in the Rural Notes program
rurality.app is the public front door to a research program on three dimensions of rural in which I am currently interested: measurement, public policy (mostly in the form of election administration), and political attitudes and behavior. The posts that follow this one will often use the data the app provides. Sometimes these data will be joined to public-opinion surveys like the Pew American Trends Panel, sometimes joined to election returns, and sometimes just considered on its own. I want to ask substantive questions both about how rural Americans think and experience public policy, and how the answer depends on which “rural” you mean.
The next post in the series will work through that measurement question directly, using the app’s own data layers as the running example. After that, I hope to settle into a rotation of measurement essays, re-analyses of public data, reviews of other people’s work, and short puzzles about what an ideal survey would have to measure.
Try it
rurality.app is live and free. There is nothing to install and no account to create. If you find something broken, confusing, or worth a feature request, you can reach me through the contact form or open an issue on the GitHub repository.
Rural Notes is a working-notes series. The posts are research-in-progress, not finished work. Subscribe via RSS for occasional updates.